Definition of Signal to Noise Ratio
The signal-to-noise (S/N) ratio is often used as a yard-stick to measure the sensitivity of a GC/MS instrument. The S/N ratio will be described here. Note that practical detection limit is very difficult to estimate in general, because the limit depends on many factors: compounds, matrices of the samples, and so on.
The Factors Determining Signal to Noise Ratio
Sensitivity is affected by many factors. Some important factors related to hardware and analysis are listed here. It is important to increase signal intensity and decrease noise for high sensitivity analysis.
Some data treatments, such as over-smoothing and a mass chromatogram with an unrealistic narrow mass window, could also improve the S/N ratio, but these are meaningless for practical analysis.
The Factors Determining Signal to Noise Ratio
A. Signal intensity
- Amount of sample in the ion source
- Efficiency of ionization
- Transmission efficiency of lens system and rod system
B. Source of Noise
- Electrical circuit noise.
- Chemical background such as contamination in the ion source region, GC injector, liquid phase of column, mechanical parts in the vacuum chamber.
- Contamination included in the sample, vials and syringe.
- Residual gas from mechanical parts in the vacuum and a vacuum chamber itself
How to Determine Signal-to-Noise Ratio
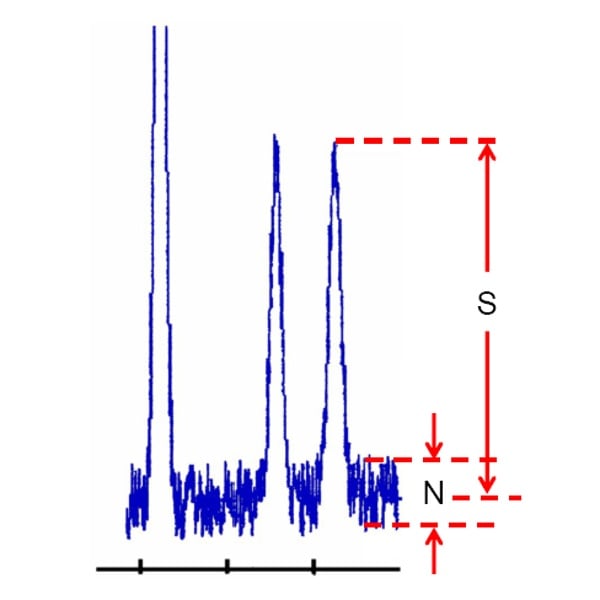
Signal-to-noise often is used to help determine the limit of detection or limit of quantification of an HPLC method. To make this measurement, you’ll need to have a chromatogram under the desired conditions that contains enough baseline to measure the noise accurately – often 3-20 times the width of the peak. An example is shown in Figure.

Expand the chromatogram sufficiently to facilitate the measurements, and transfer it to a graphics program or print a copy if it makes the measurements easier. First, measure the baseline noise to capture the width of the baseline, which is the noise, N, in Figure.
Next, measure the signal, S, from the middle of the baseline noise vertically to the top of the peak of interest.
As per the above figure the measurements are
N = 66
S = 367 (arbitrary units).
Most analyst calculate S/N just as the ratio of the signal to the noise,
so S/N = 367/66 = 5.56 in this example.
However, The United States Pharmacopoeia (USP) and European Pharmacopoeia (EP) use a different calculation where only half of the noise band is considered.
In their documentation, they call the signal H and the noise h, defining
S/N = 2H/h.
You can see that this reported value would give S/N = (2 x 367) / 66 = 11.1 in the present case, which is twice the intuitively defined ratio.
Tags
Chromatography
