A system suitability test (SST) is a test to determine the suitability and effectiveness of a chromatographic system before use. The performance of any chromatographic system may continuously change during its regular use, which can affect the reliability of the analytical results. The operation parameters of the whole chromatographic system can be checked with properly selected SST mixtures.
These mixtures are used to establish characteristic chromatographic parameters, such as the number of effective theoretical plates, resolution, asymmetry, detection limit, and selectivity. The system is then only declared suitable if the responses are within the given limits.

United State Pharmacopoeia
- The USP states: System suitability tests are an integral part of gas and liquid chromatographic methods. They are used to verify that the resolution and reproducibility of the chromatographic system are adequate for the analysis to be done.
- The tests are based on the concept that the equipment, electronics, analytical operations, and samples to be analyzed constitute an integral system that can be evaluated as such.
- It goes on to mention resolution, column efficiency and peak symmetry as measurements that can be made but it makes no recommendation as to requirements for these parameters. For precision, the USP states: Unless otherwise specified in the individual monograph, data from five replicate injections of the analyte are used to calculate the relative standard deviation (SR) if the requirement is 2.0% or less; data from six replicate injections are used if the relative standard deviation requirement is more than 2.0%.
- The USP tells us that the parameters in the monograph (method) do not need to be followed if other suitable operating conditions are chosen. The final requirement is, “No sample analysis is acceptable unless the requirements of system suitability have been met.”
- A system suitability test must be run, it should have some defined parameters and it should test the entire system with a real or surrogate sample.
ALSO READ: HPLC Column Care and Maintenance
International Council for Harmonisation
- The ICH has released several Guidance for Industry documents to summarize the current thinking of the organization. One of these guidances, “Q2B: Validation of Analytical Procedures: Methodology”, has a section devoted to system-suitability testing.
- System suitability testing is an integral part of many analytical procedures. The tests are based on the concept that the equipment, electronics, analytical operations, and samples to be analyzed constitute an integral system that can be evaluated as such. System suitability test parameters to be established for a particular procedure depend upon the type of procedure being validated.
Food and Drug Administration
- The United States Food and Drug Administration (FDA) also issued a document “Guidance for Industry: Bioanalytical Method Validation”. This document includes just one sentence under the section “Application of Validated Method to Routine Drug Analysis”:
- System suitability: Based on the analyte and technique, a specific SOP should be identified to ensure the optimum operation of the system used.
System Suitability Parameters
Now, let’s move on to the parameters that have to be checked under this testing.
Retention
- Retention time is one of the easiest measurements to make and track in an LC run. It is also important that retention time be fairly constant because the data system uses retention time to identify peaks; peaks that drift outside a certain retention time window might not be reported by the data system. Retention time is not important and might vary from one nominally identical instrument setup to another.
- For system suitability, it is good to set a retention time window or approximate value. This will allow for some variation in mobile-phase composition from batch to batch or a gradual change in column characteristics.
Retention factor (k)
- Retention factor (k) or partition ratio or capacity factor is the relation of time spent by a compound in the stationary phase to the time it spends in the mobile phase. This is one of those parameters that can be identified without any hassle.
k is a unitless quantity \(k = \frac{t_r – t_m}{t_m}\)
- The higher the value of k greater is the retention of a compound on a column
- Ideally, k should be greater than 2.0
Resolution
- The resolution, the separation between two peaks, is one of the most critical system suitability parameters. System suitability, in one way of thinking, is a mini-validation that shows that the method is still valid for use. Usually, the separation of one or more key peaks from other peaks is the objective of an LC method.
- Selecting resolution as a system-suitability parameter is one way to ensure that the critical separation is possible under the current conditions. Setting an easily attainable “resolution greater than” specification allows more flexibility than stating a specific value of resolution that might be difficult to obtain when conditions change slightly.
Calculation of Peak Resolution
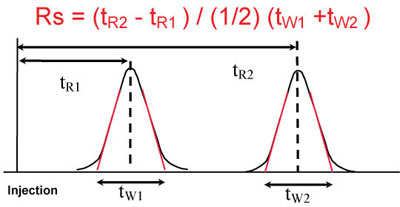
Note: tw1 and tw2 are obtained from the intersection of the tangents with the baseline. For a symmetrical Gaussian peak the tangents are drawn at 0.6 times the peak height.
Where:
Rs = resolution
tR1 = time resolution 1
tR2 = time resolution 2
tW1 = time peak width 1
tW2 = time peak width 2
Response
- Response, in terms of peak height or area, might or might not be an important system suitability parameter to include in tests. If the method is a stability-indicating assay, bioanalytical method or other methods that must detect trace concentrations of analyte, it needs assurance that you can reach the detection limits necessary. In this situation, a system-suitability test should include one or more injections at the lower method limit.
- Alternatively, if the method is used to determine only high concentrations, such as confirming content uniformity, a response might not be important. As long as there is a reasonably sized peak, the method should work well.
LOD, LLOQ, and S/N
- The limit of detection (LOD), the lower limit of quantification (LLOQ), and the signal-to-noise ratio (S/N) all relate to the quality of the detector signal at low concentrations of a sample. This is another way to look at detector response. If the method is used for trace analysis, such as a stability-indicating assay, an impurities assay, or a bioanalytical assay, it is important to ensure that the method performs at the lower end.
- Methods that fall in this category often include one or more samples at the lowest concentration of interest to verify the LOD, LLOQ, and S/N.
- Signal To Noise Ratio (S/N) is used for the lower-end calculation of the performance of the system.
- Noise: It is measured between two specific lines that bracket the baseline.
- Signal: It is measured starting from the baseline’s middle and ending to the peak’s top.
- Once calculating both these factors, the ratio can be measured by dividing the signal value by the noise value. With this, generally, the noise value has to be reduced using one of the following methods:
- Signal Averaging
- Reagent and Solvent Purity
- Column Flushing and Sample Clean-Up
- Temperature Control
- Additional Pulse Damping and Mixing
Theoretical Plate Number
- Peak response and resolution are critical parameters that depend indirectly upon plate number so if you have these parameters as part of your test, there is not much point in measuring the plate number.
- For gradient methods, plate numbers are difficult to determine and peak width at half-height might be a more appropriate parameter. If you choose to include the plate number as a suitability parameter, be liberal with the requirement so that normal column deterioration can occur without failing suitability or you will end up replacing columns with plenty of useful life left.
Calculation of the number of Theoretical Plates per meter (USP method)
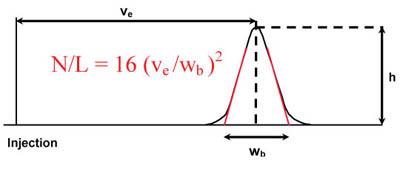
Where:
N = Number of theoretical plates
L = Length of column (m)
Ve = elution volume of an unretained non-interactive molecule
h = height of probe peak
wb = width of the peak at the base line2.
Calculation of the number of Theoretical Plates per meter (half-height method)
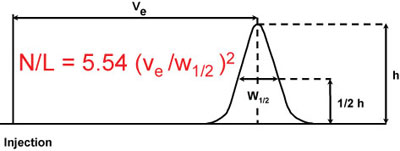
Where:
N = Number of theoretical plates
L = Length of column (m)
Ve = elution volume of an unretained non-interactive molecule
h = height of probe peak
w1/2 = width of the peak at half peak height
Calculation of the Height Equivalent to the Theoretical Plate (HETP)
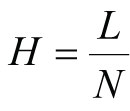
Where:
H = Height equivalent to the theoretical plate
L = Length of the column bed
N = Number of theoretical plants
Reduced Plate Height
- A dimensionless and thus convenient parameter for efficiency characterization is the reduced plate height h. This parameter facilitates the comparison of column efficiency irrespective of column length and particle diameter of the medium.
Calculation of Reduced Plate Height (h)
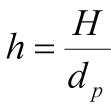
Where:
h = reduced plate height (sometimes referred to as the number of bead widths)
H = Height equivalent to the theoretical plate
dp = mean particle size
Peak Tailing
- Tailing peaks can destroy a separation and reduce sensitivity below the required levels. They can also be good indicators of column deterioration or errors in mobile-phase preparation.
- In other instances, peak tailing might not be very important, such as when only one or two peaks are present and excess resolution exists. If the peaks in your separation tend to tail and this will have a negative impact on the method performance, include a tailing factor requirement in the system-suitability test.
Calculation of Peak Tailing
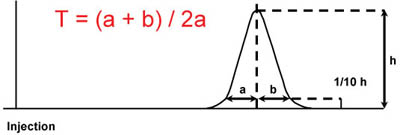
Where:
T = tailing factor
b = distance from the point at peak midpoint to the trailing edge (measured at 5 or 10% of peak height)
a = distance from the leading edge off of peak to the midpoint (measured at 5 or 10% of peak height)
Peak Asymmetry
- A peak is considered asymmetric when the distance from the start of the peak to the centre (A) and from centre to the end (B) of the peak differs. It is best to measure these distances at about 10% of the peak height. Within asymmetric peaks, two possibilities could exist; Fronting and Tailing.

Calculation of Peak Asymmetry

Where:
As = peak asymmetry
b = distance from the point at peak midpoint to the trailing edge (measured at 5 or 10% of peak height)
a = distance from the leading edge off of the peak to the midpoint (measured at 5 or 10% of peak height).
Precision
- Precision measurements define how reproducible the results are and give you confidence in the data you will gather. If the method uses external standardization, precision measurements assure that the autosampler is delivering the same volume each time and that sample preparation provides a consistent yield.
- When internal standardization is used, the internal standard will compensate for some instrument imprecision and a precision measurement might not be necessary. Generally, six replicate injections will give you a very good idea of the method's precision.
- Data from five replicate injections are used if a requirement of relative standard deviation is less than 2%. Data from six replicate injections are used if the requirement of relative standard deviation is more than 2%.
Accuracy
- Accuracy is the measurement of how close an experimental value is to the true value. LC and LC–mass spectrometry (LC–MS) methods almost always use a standard of known concentration for comparison to unknown samples using either external or internal standardization techniques.
- Running a standard curve at the beginning of a run sequence or injecting replicate standards for a single-point calibration will establish the accuracy of the method. Because this is normally part of the method itself, accuracy is often not included in system suitability.
Pressure
- Many laboratories set pressure limits, above which it is not recommended to run a method. For example, in my laboratory, we like to keep the pressure less than approximately 3000 psi. This helps reduce wear of system components, which increases as the pressure goes up. Also, the first sign of column failure is often an increase in pressure. For this reason, we include a pressure check as part of the system suitability in most methods to help reduce the chance of column failure or system over-pressure during a run sequence.
Blanks
- Samples that do not contain any analyte can be used to determine carryover and confirm reagent purity. Such samples are often injected immediately following a high concentration standard to measure carryover. Depending upon their purpose, blank samples can comprise a blank extracted matrix, selected reagents or just the injection solvent.
Priming Injections
- Some methods require one or more priming injections before the retention, response or tailing settles down to a constant value. This might be the situation when some of the sample components are retained strongly on the column and act to deactivate unwanted interaction sites. If priming injections are required for your method, these should generally be run before the system-suitability test.
Use of Quality Control Samples
- Quality control samples are spiked samples of known concentrations that are interspersed with study samples during a run sequence. By back-calculating the assay value of quality control samples against a standard curve, you can show that the method is performing as desired. Some regulatory guidelines specify the performance of quality control samples, such as all quality controls above the LLOQ must be within 15% of the standard curve response. Generally, quality control samples are not considered part of the system-suitability tests.
Summary
- The preceding list of possible system suitability tests are by no means exhaustive. If all of these tests were run for every method, there would be no time to run actual samples. It is up to the method developer or analyst to determine which set of tests will provide the most assurance that the method is running as expected.
- The number of tests and specific results will depend upon the application. A cleverly designed system-suitability test should get the most information out of a minimum number of injections. For example, if you do not need precision data, one injection at the upper limit of the method followed by an extracted blank and an LLOQ sample might be sufficient to generate retention, response, carryover, reagent purity, peak tailing and pressure measurements.
- You should set the system-suitability requirements so that they can be met easily if the method is working right but will fail if there is a method problem. Test requirements that are too stringent might not make the method any more reliable and might only serve to delay the analysis of important samples. The regulatory agencies make one thing clear: system suitability should test the entire chromatographic system, not individual modules.
- One way of thinking about the system-suitability test is to consider it a mini-validation run just before each set of samples are run. When designed and used properly, system suitability should save you time and money — you will not waste time trying to analyze samples with a method that is not working correctly.
Tags
Chromatography